Web Development Fundamentals: the Inspector Gadget

Let's explore one of your browser's most-useful features! Every modern browser comes with a set of development tools that everybody should learn how to use. It is really very simple once you get to understand its parts. Whether it's for inspecting your own creations or verifying the security and operation of other online systems, the code inspection gadget and its suite of connected development tools is just the thing for you.
Are you using a major browser? You already have the tools ready to use. Do you know how to access them? The Developer Tools is usually a prominent item in your browser's main menu, or it can be accessed with the keyboard shortcut: Shift + Ctrl + i (you can remember "i" for "inspector").
Please open the King Book web library in another window while you read these instructions.
Open King Book in a separate tab.
Remember you can read these instructions on your phone! King Book is a good website to inspect as the output isn't cluttered with errors or constant network activity. I've also kept a lot of the debugging output so it is possible to witness more of the logic that is processing behind the scenes by viewing the console log. Of course you can inspect any website, but the output each website displays in the development tools will be very different for each website. So for congruency here, I'll continue assuming that you are going to be inspecting King Book and its other connected websites.
Alright, now that you have King Book main site open, go ahead and open the Developer Tool there. Remember, it can usually be accessed with the keyboard shortcut: Shift + Ctrl + i
If you are using the popular and lovely Firefox browser, you will see something like this:
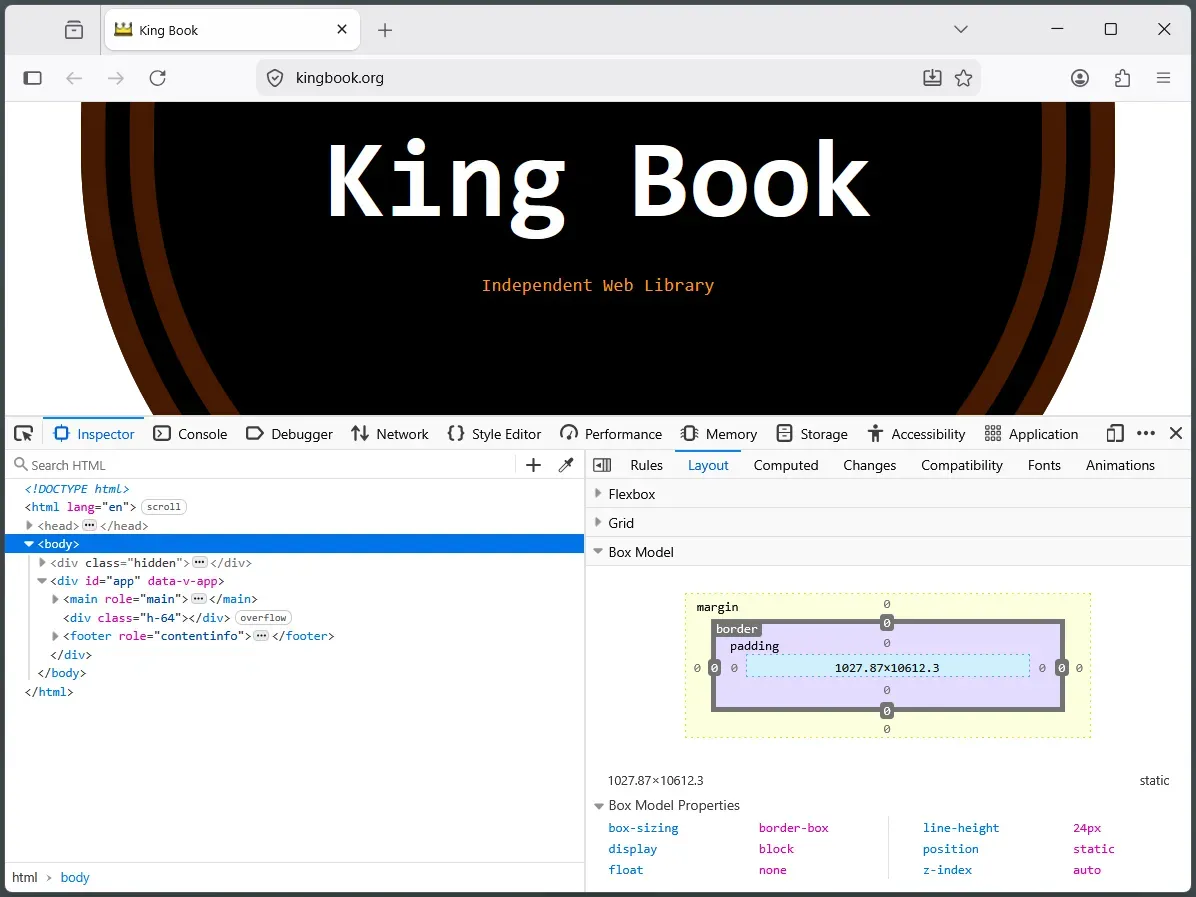
As you can see, here we have the Inspector tab of the Development Tools open. This tab has two main parts: on the left you see the page's HTML code, on the right is CSS and other information that concerns the visual layout and styling of the page.
On the left, you can expand the nested HTML document sections to reveal more HTML code for your inspecting pleasure. Click on the cursor icon just to the right of this Inspector tab and then hover your cursor over items on the web page if you want to find the HTML code for a particular visual element on the actual website.
You can also edit the HTML locally and temporarily from this left-side Inspector window. Right click on a block of HTML and select "Edit as HTML" to write your own HTML. If you've never done this: try changing the text of a title somewhere. It isn't destructive because you are only changing the appearance of the website on your device. Developers can do this to quickly test how simple changes look. Reload the page to reload the real code again.
The right side has its own set of tabs that reveal even more information. I find the Rules and Layout tabs to be the most helpful. You can even toggle or modify the CSS rules to see what it will look like.
If you are anything like me, you'll probably learn best from here just by clicking around and learning more about all the parts of the Inspector tab's panels by exploring and researching terms you don't know. Let me know if you have any questions or get stuck!
I will stop here as there is plenty to learn and explore in this one tab alone. In the next segment of this series on your web browser's Development Tools tool, we'll review the "Console" tab as we witness some of the automatic behind-the-scenes output that is produced by one of the games at our King Book web library.
Stay tuned, the Web Development Fundamentals: Console link will appear here soon!
<3 Grant